

As part of his annual decarbonisation presentation, climate and clean-tech researcher Nat Bullard has published some fascinating charts on various trends in renewable energy and electric vehicles.
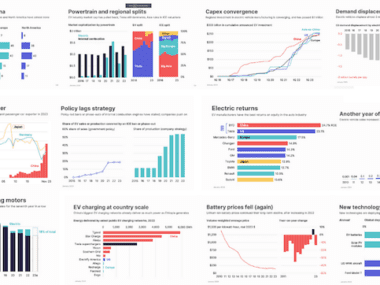
Posted on twitter this week, Bullard’s 200 page slide deck is packed with well presented charts covering global warming, clean energy growth, deforestation and sustainable finance trends as well as a series of graphs covering EV battery manufacturing, EV uptake and global EV public charging capacity.
It's here: my annual presentation on decarbonization.
There is a lot going on, and I attempt to capture it in 200 slides. Ocean heat content, deforestation, fund performance, vehicle efficiency, lighting technology, GLP-1 agonists, and much more. https://t.co/DxlE3kbl13 pic.twitter.com/ONJbXB7twH
— Nat Bullard (@NatBullard) January 31, 2024
EV Batteries
Prices of lithium-ion batteries continued their long-term downward trend dropping another 13% year-on-year in 2023.
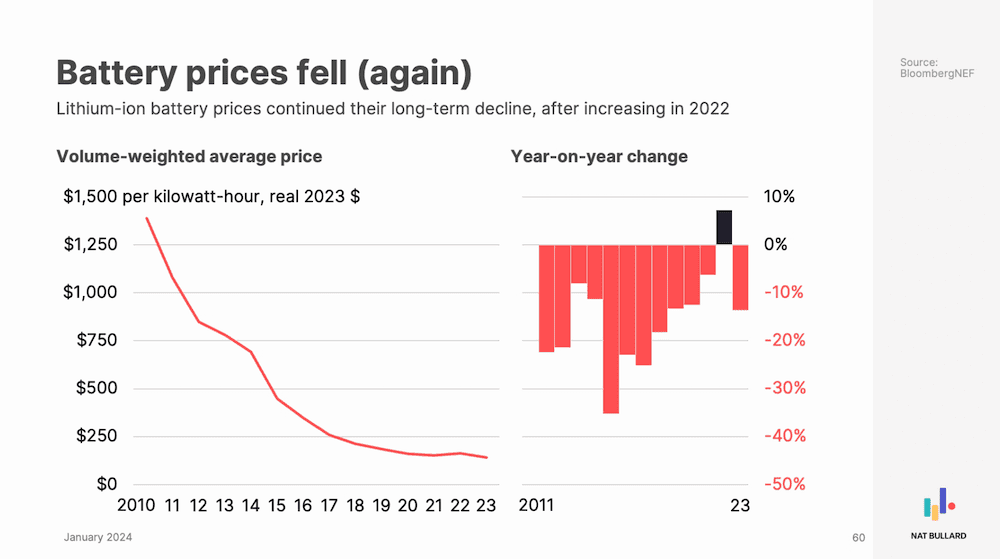
The real-world battery price curve is scarily close to the prediction made by Tony Seba in his 2014 book Clean Disruption.
Li-ion #batteries from CATL and BYD dropping as low as $56/kWh. 🔋
"Currently, VDA-sized #LFPcells are selling for less than RMB 0.5/Wh [USD $69.53/kWh]. Leapmotor's vice president Cao Li recently said in an interview that the company's procurement cost for LFP cells has dropped… https://t.co/QasXsLvqtJ
— Tony Seba (@tonyseba) January 20, 2024
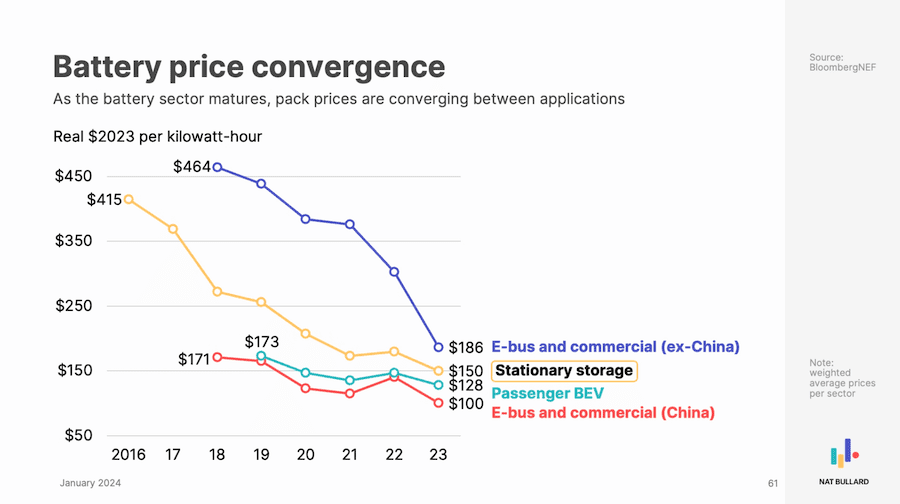
Bullard’s data also shows that battery prices are converging as manufacturing scales and technology matures. This essentially represents the commodification of batteries.
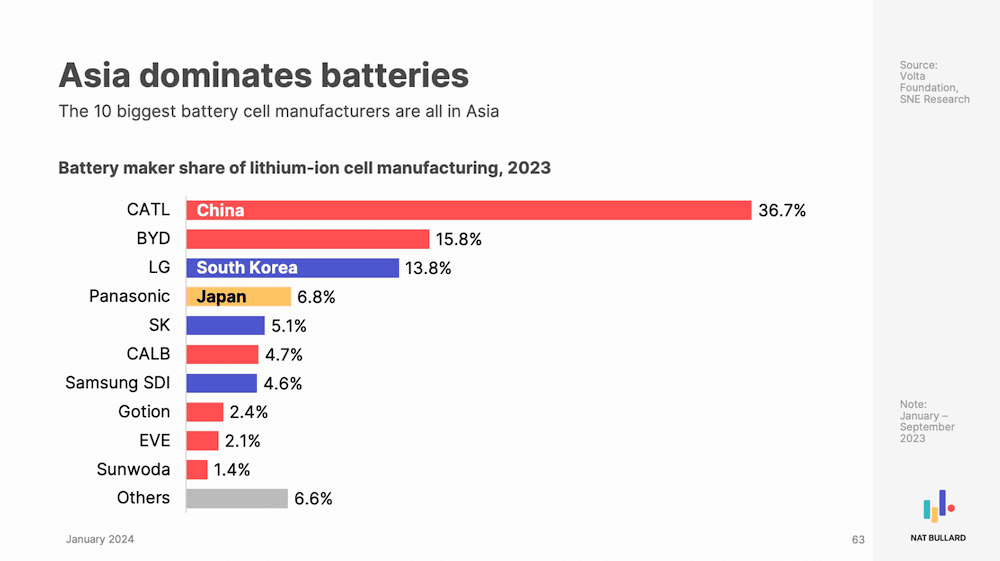
On EV battery production, Bullard shows the dominance of the Chinese manufacturers with CATL and BYD together holding 52.5% of global market share.
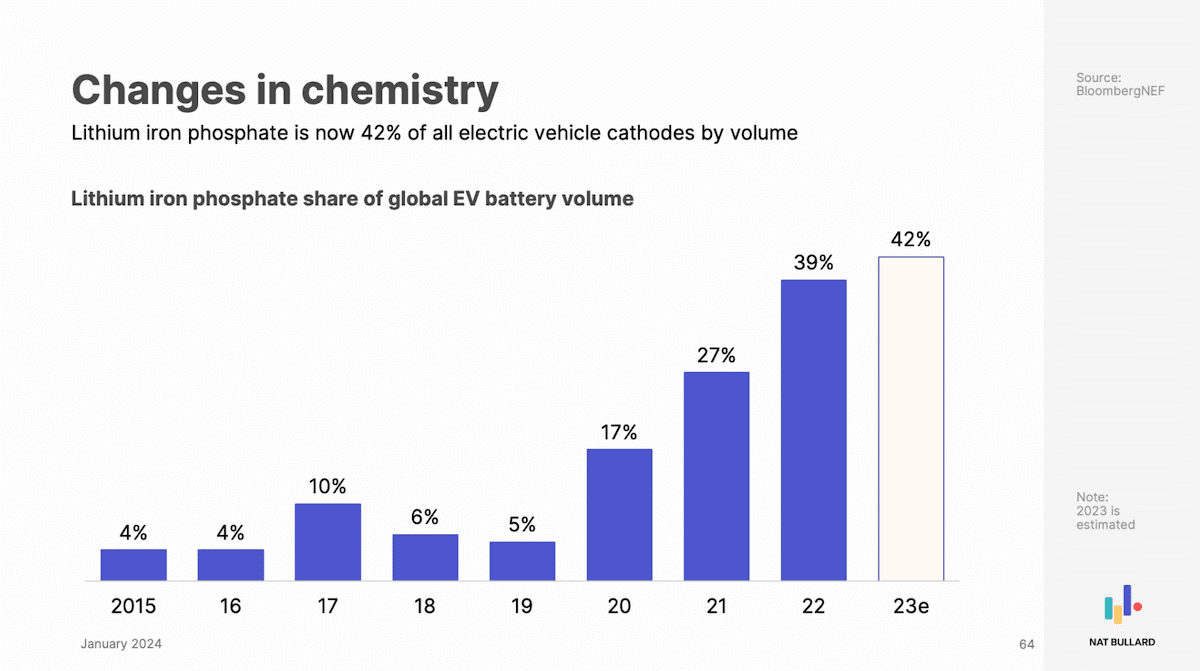
The charts also document the change in battery chemistry with the rise of lithium iron phosphate (LFP) batteries. In 2019 LFP batteries made up just 5% of production, in 2023 they make up around 40%. Recent reports suggest cost of CATL’s LFP batteries will be cut in half again by mid-2024.
Electric Vehicle Charging Networks
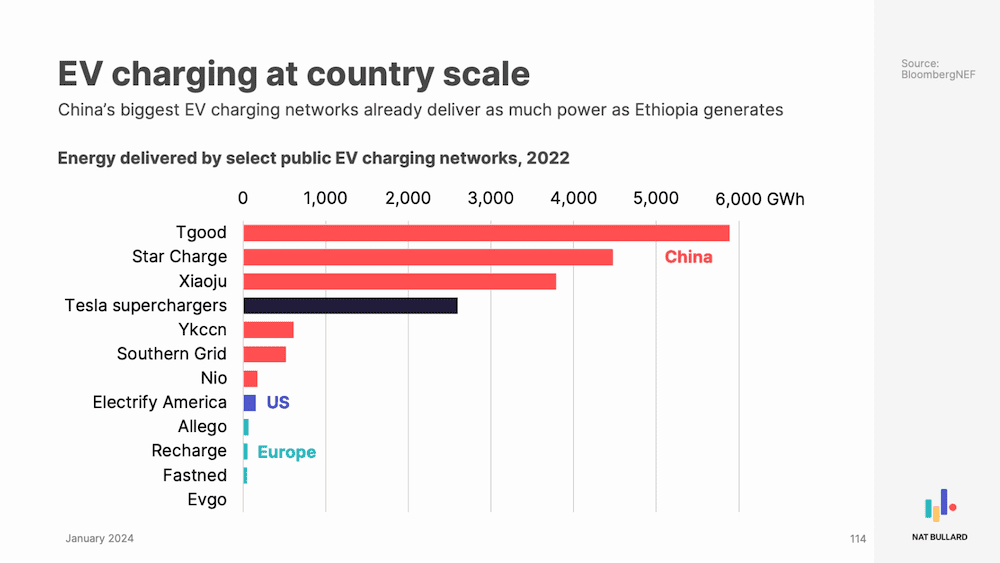
Bullard also looked at global charging networks with surprising results. Three Chinese public charging networks each delivery more power than Tesla’s massive 50,000 Supercharger worldwide network.
Electric Vehicle Sales Growth
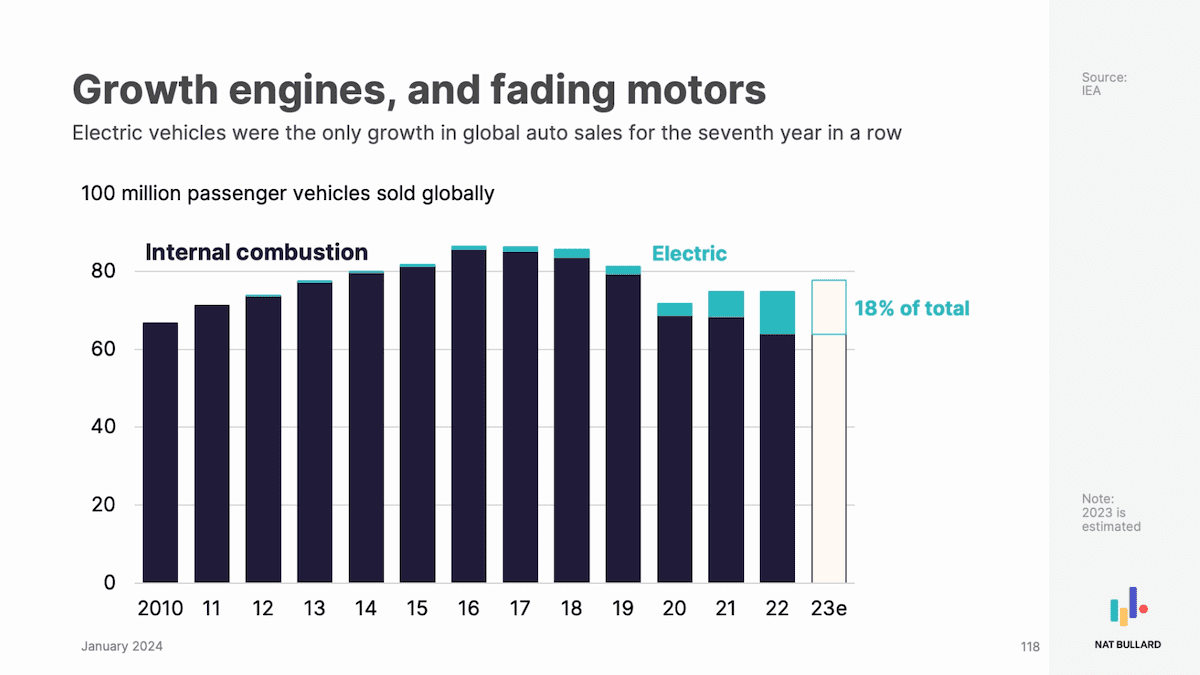
Using data from the International Energy Agency, Bullard shows that ICE (internal combustion engine) vehicle sales have been in consistent decline over the past 7 years with the only growth in global auto sales coming from EVs.
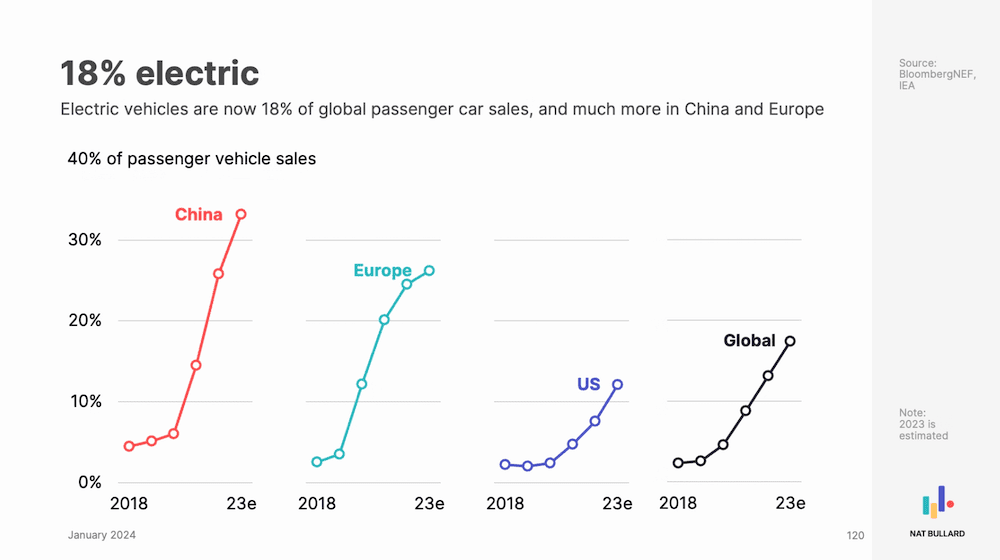
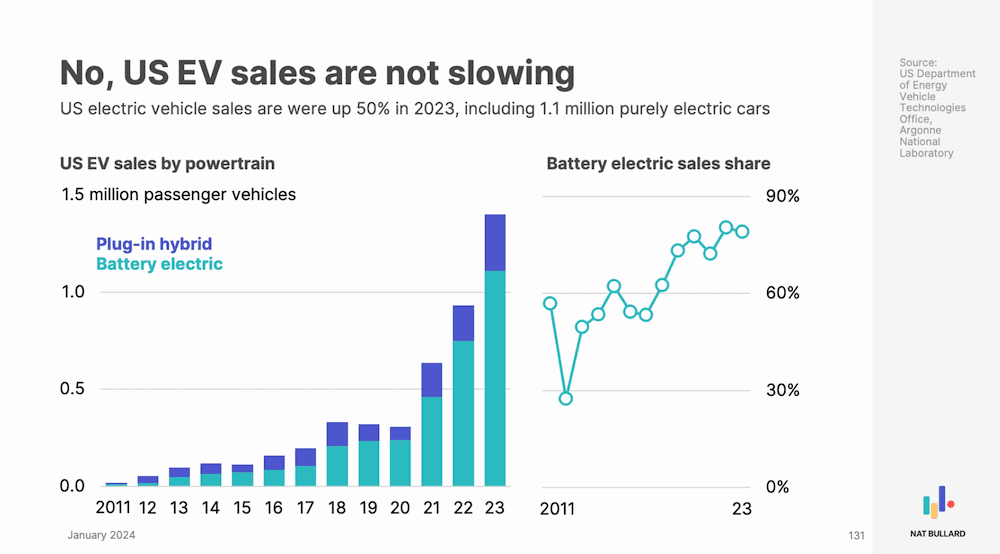
On global EV uptake, Bullard says 18% of global passenger cars are now electric with China and Europe ahead of the global average. While the US lags global average, it has seen significant growth in EVs in 2023 despite mainstream media reports to the contrary.
EV makers showing massive returns compared with ICE vehicles
Not only are EV sales growing while ICE vehicle sale decline, EV makers are also generating the highest returns with Tesla and BYD outperforming all major ICE vehicle manufacturers by a significant margin. Another report this week showed that investments in ICE vehicle companies are now more carbon intense than investments in oil companies.

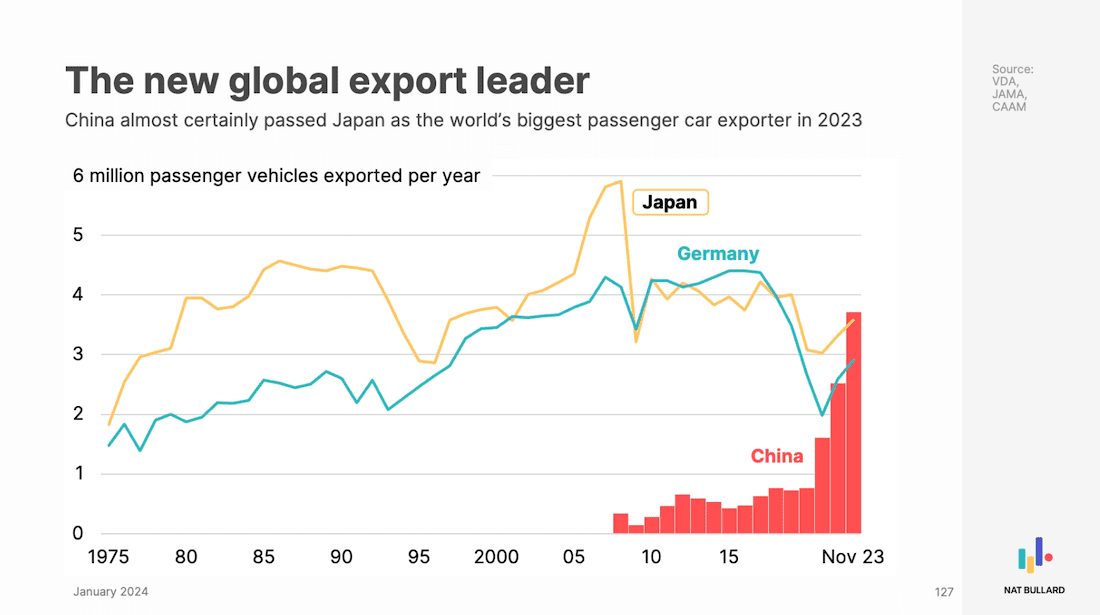
China’s incredible growth in EV manufacturing is being reflected in global car exports with China passing Japan as the world’s biggest passenger car exporter in 2023.
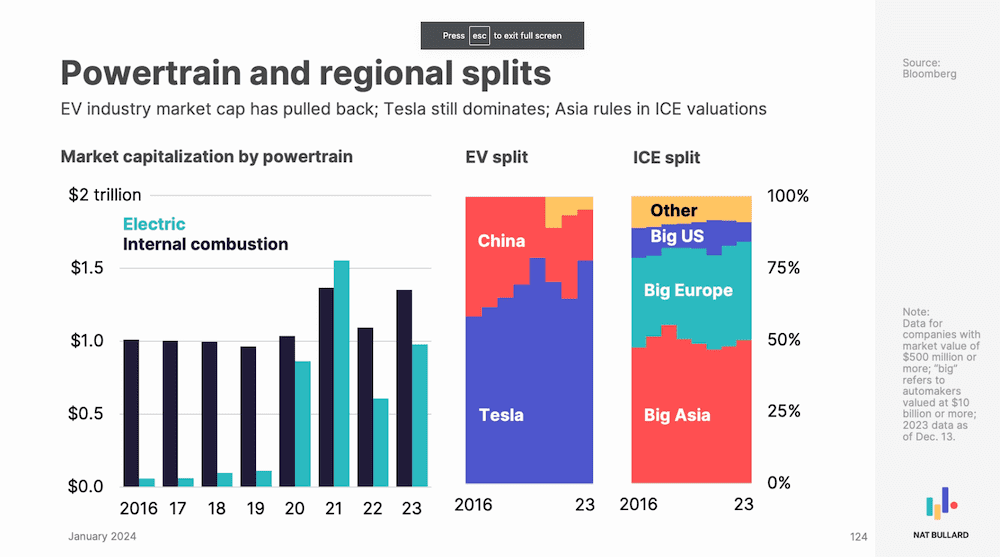
In another fascinating graphic, Bullard shows capital investment breakdown for global EV and ICE manufacturers. While Europe still has significant capital investment in ICE manufacturing, EV capital is dominated by Tesla and China.
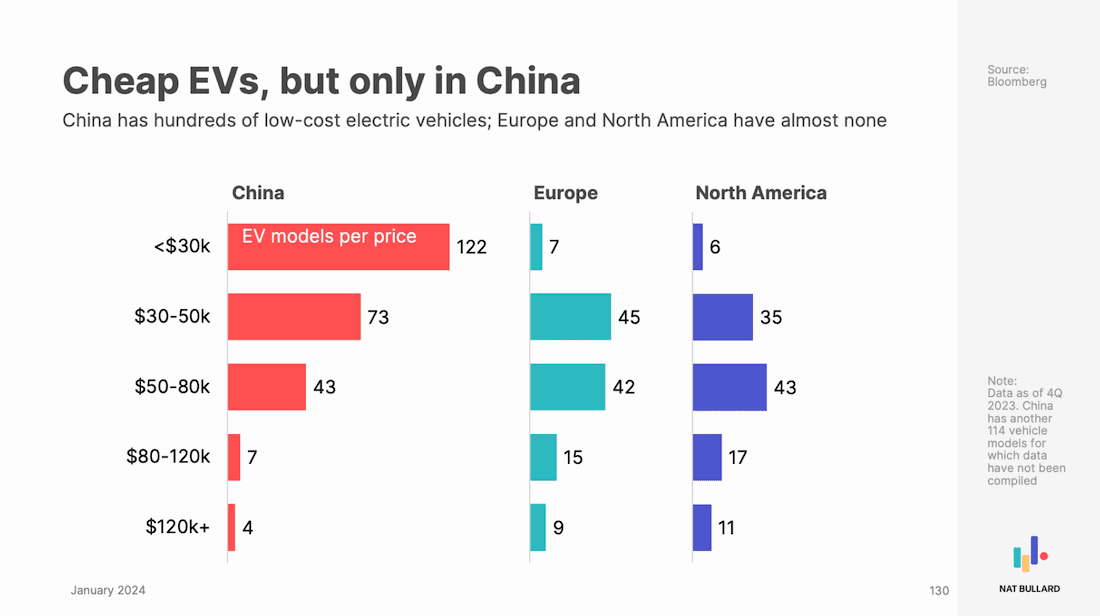
On EV pricing Bullard shows huge variation between the world’s three largest car markets. China has the largest proportion of models in the sub $US30,000 category while affordable models are still relatively scarce in Europe and North America.
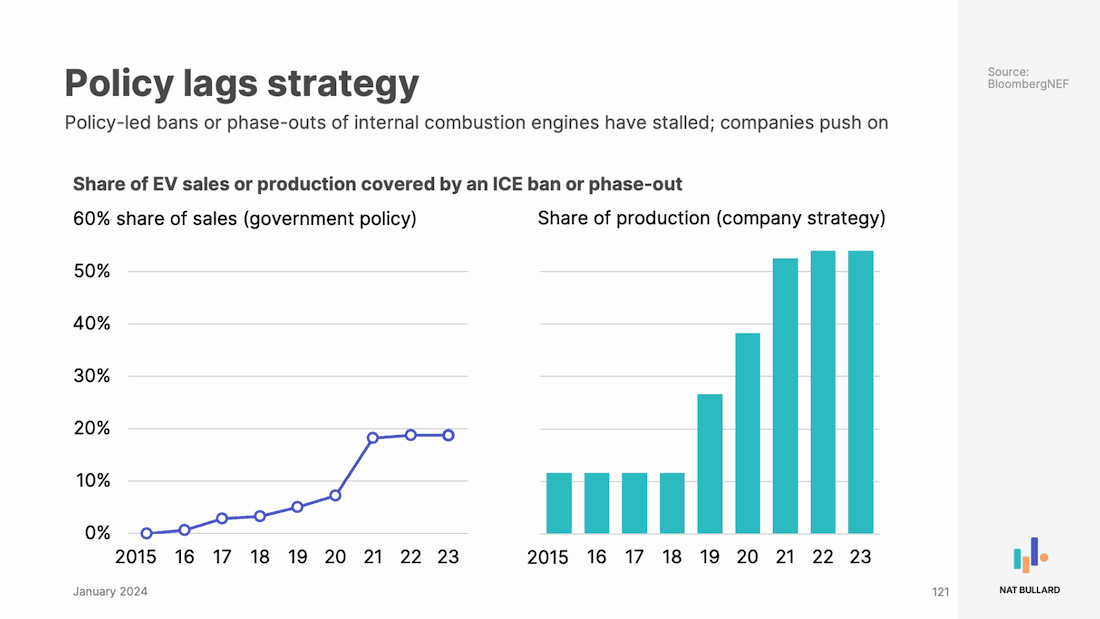
Government policy not driving the shift
Bullard also provides valuable insight into the effectiveness of global government EV policies showing that although 60% of governments have policies to ban or phase-out ICE vehicles, their ambition significantly lags automotive company transition plans. Note that although many major automakers have publicly stated they have bold plans, most are failing on their commitments.
These are just a few samples of the 200 slides in Bullard’s 2023 presentation: Decarbonization: Stocks and flows, abundance and scarcity, net zero which is an extremely valuable contribution to our understanding of the global clean tech transition.
You can see the full slide deck here and follow Nat Bullard on X.

Daniel Bleakley is a clean technology researcher and advocate with a background in engineering and business. He has a strong interest in electric vehicles, renewable energy, manufacturing and public policy.